3 emerging styles of motion graphics in 2021
While the term ‘motion graphics’ is new, it has become an essential part of design in recent years.
Motion graphics are animations combined with audio. Usually designers make them using a computer. In other words, they are not films that get shot using actors or locations in real life. “Audiences generally watch motion graphics are on the internet,” said Frazer King from motion graphics firm Votion.
Recently, animation has boomed. The reason is the global Covid19 pandemic. During the pandemic, live-action productions have faced delays due to the coronavirus. Animators have faced no such problems. It is easy to make an animation in a computer without leaving your home.
With motion graphics there is no need for actors to meet or crews to assemble. Everything can be done online. As well as being Covid-safe, motion graphics are much cheaper than using real live actors and locations.
That has created a new interest in animation in Hollywood and beyond.
Covid has also seen a corresponding boom in viewership. Video streaming has been especially popular. The boom saw new U.S. video subscribers rise to 12.9% of households during in 2020.
Since then the rate has levelled off. It is currently at 3.9%.
Video continues to dominate the internet. The numbers can be staggering.
Over 500 million people watch Facebook videos every day. YouTubers upload 300 hours of video content to the platform every minute. 93% of businesses gain new customers as a result of video content.
People spend an average of 6 hours and 48 minutes per week watching online videos. That is why advertisers use motion graphics for campaigns. And it is also why designers use motion graphics to make content or full length movies.
With so many potential uses for this industry-changing technology, what will come next?
In 2021, we’ve seen a shift towards three emerging styles. Those styles are minimalist design, textured animation and 3D animation.
This blog post explores each style of motion graphics. It gives inspirational examples and discusses what might be the future of animation.
New technology and changes in how we consume video have driven these new styles.
Minimalist Design
Minimalist design focuses on simplicity and intuitiveness. It does not rely on flashy effects or a large quantity of content.
This style has become popular due to plenty of free resources online. They allow you to build your own animation fast.
These styles have become especially popular in social media marketing. The fast-paced nature of content production means they can be responsive to trends. With minimalist design there is no need to scout locations, fly in actors or even check the weather. All the production work occurs inside a computer.
Existing software can make the process even faster. Animations created in just one day can get large audiences.
Brands must stand out from competitors and styles such as minimalism can help. Minimal design often has a good deal of impact. That is vital if you want to catch viewer’s attention.
The styles below show how brands can use this approach to captivate their audience.
Specimen, is a colour matching game for iOS. It is an app whose design is as simple as it is effective.
The Illusion of Life presents 12 universal principles for animation. Instead of using characters it uses cubes.
Minimalistic animation by Nicolas Menard uses crayons instead of complex graphics.. Music gives the visuals character and life.
Bran Dougherty-Johnson’s showreel from 2015 takes simple graphic vectors to new levels.
Textured animation
Textures in motion graphics appear natural and organic. They seem more tactile than traditional styles due to the way they interact with light.
The styles tend to contain more atmosphere. They create an illusion of depth or movement that mimic real-world. Take a look at the styles below that explore this technique.
Sofia El Khyari’s animated short Le Corps Poreux makes tactile use of watercolours. It tells a metaphysical story about a young woman who heads to the sea to re-discover herself.
Tuscany is a hand-drawn animation painted in Photoshop, five seconds at a time. Creator Coleern Bairk completed it over the course of 15 months.
The animation is inspired by a night spent in a cement annex on an isolated Tuscan farm. It explores fear, paralysis, and rebirth, he says.
Pink is Giant Ant’s addition to CNN’s Colorscope series. It features a soothing, delicate texture.
According to creator Eric Pautz each scene washing over the previous one is calming. He animated the objects a little slower than reality. That means they appear larger-than-life.
“That helped with the dream-like vibe we were going for,” said Pautz.
3D motion graphics
3D graphics are particularly popular on Instagram. Great examples abound.
“Unbreakable” explains what it feels like to suffer from nontuberculous mycobacteria (NTM). The film stars Barbara the Bunny, a plush toy built in a magical factory. As she comes alive, she coughs, splitting a piece of her fabric. “Quality Control” throws Barbara out of the factory.
Barbara the Bunny then heads off on a quest to find a specialist doctor who can help her. To Barbara’s relief, a sweet toy repair shop owner comes to her rescue.
The creators use rich, poetic visuals to engage the viewer with the concerns of NTM sufferers.
An ad for high yield bond funds uses 3D motion graphics to create marbles. We see them roll over a landscape. It feels completely reel.
This showreel from Fugu makes affecting use of abstract 3d textures and a voice over of pure doom.
Bugged used 3D animation software to turn clay into life-like computer animations.
The future of animation
There is a need to animate for specific devices such as Virtual Reality headsets. Headsets such as Oculus and Hololens open up new creative opportunities. Brands and designers can take advantage.
VR means designing animated experiences in an immersive digital environment.
Psyop have launched a wholly-owned VR experience called Kismet.
Kimset takes Tarot card reading sets it in Virtual Reality. The game features a deck of 22 hand-painted Tarot cards and an accurate real-time map of the solar system.
Kismet offers unique outcomes every calendar day, tied to the cards that you choose. Your birth date and the real alignment of the stars at the time of your reading also effect the reading.
As we see, there are many styles of motion graphics you can use. Each offers a different advantage. But when it comes to success, the future of motion graphics is foretold.
Related stories
Try this sniff test to see if your business stands out
Business intelligence tools give your business a competitive advantage
6 undeniable reasons why Power BI is a good skill to have for any marketer
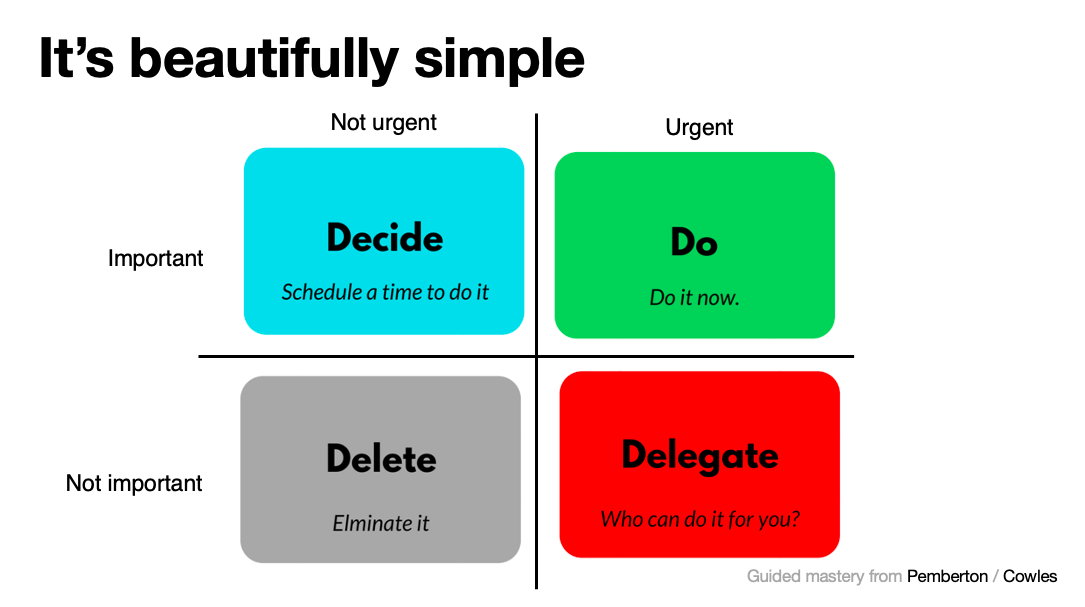
Everything you need to know about advertising on one annotated slide
About the author

My name is Andy Pemberton. I am an expert in data visualization. I guide global clients such as Lombard Odier, the European Commission and Cisco on the best way to use data visualization and then produce it for them: reports, infographics and motion graphics. If you need your data visualized contact me at andy@furthr.co.uk or call 07963 020 103
Posted in: Infographic of the day | Leave a Comment