What is motion graphics? Exploring 4 types you should know about
 Motion graphics is a visual language. It uses individual images, text, and video to create animated sequences.
It’s been around since the 1970s but has exploded in popularity in recent years. Modern technology has made it easier for people to produce. More distribution means more people can find it. The appetite for content is global. Motion graphics are easy to understand no matter what language you speak.
If you combine motion design with graphic design you get motion graphics.
What is the difference between animation and motion graphics?
Motion graphics are a type of animation. Animation is an umbrella term for the whole field of moving imagery. Motion graphics describes moving or animated graphic design. It includes everything from cartoons to claymation. In motion graphics there are few limitations. If it can be done in a computer, it can be done in motion graphics. The only real limitation is your imagination.
Why are motion graphics important? Why should marketers care?
Motion graphics have become an important aspect of a marketers armoury. If you convey information through animation it is engaging. It is easier to consume than written content. Animations can help companies explain what the company does. It can explain what makes the product or service different. It can show what data you have to back up what you do. Motion graphics are succinct and entertaining. They can be understood by everyone.
You can use motion graphics in movie clips, trailers, commercials, title sequences.
Emotive videos move the audience to feel something. The primary aim of these videos is to elicit a powerful, emotional response from the viewer. As we know, emotion drives behaviour. If you want your adience to take an action, engaging their emotions is the best way to do it.
Explainer videos help define a concept, product or service. Promotional videos sell a product, service or event.
Relevance to your target audience is crucial.
There are 4 types of motion graphics used by businesses. All have their own pros and cons. These are: whiteboard animation, 2D animation, 3D animation and video production.
1. Whiteboard Animation
Take a classic whiteboard and draw on it with the traditional whiteboard marker pens. But this isn’t school. This is whiteboard animation. It is a thing.
The idea is to help your audience understand what your company does. Creating an engaging, light hearted story makes your business stand out. It also makes them easy to understand.
Whiteboard animation is simple, clear and concise. It lends itself to social media advertising campaigns. Whiteboard animation is easy to share.
There is a downside. It can be time-consuming as there are no templates available. Each video must be hand-tooled for your business and its customers.
Here is a great example. CBS Evening News with Katie Couric used whiteboard animation. They wanted to show how super-delegates work at a political convention. They used whiteboard animation because they were exploring a complex issue. The issue did not lend itself to more conventional story-telling techniques.
By making the super delegates seem like wizards, CBS News hoped their audience could grasp their role at a convention. Some found the animations child-like. But others got the point.
2. 2D Animation
2D animation is what you would see in what you’d call traditional animation. There’s rich vibrant colours and the characters are what many people consider to be ‘cartoon like’.
This allows what you’re trying to show your audience to have more depth, colour, movement.
Examples of this include pop up graphics layered over what the story. Parallax scrolling backgrounds add extra interest to what your business does.
This type of motion graphic is good for adding interest to explain what you do. It is more appealing than talking through what you’re doing.
This style of motion graphics is a great way to create impact in advertising. It can look stunning.
Awesome Inc are a great agency with a long suit in 2d animation. Awesome Inc say there has never been a better time to be in media.
The appetite for content is insatiable, they say. Supply has difficulty keeping up with demand.
There is a greater focus on diverse voices. Which motion graphics is great at exploring.
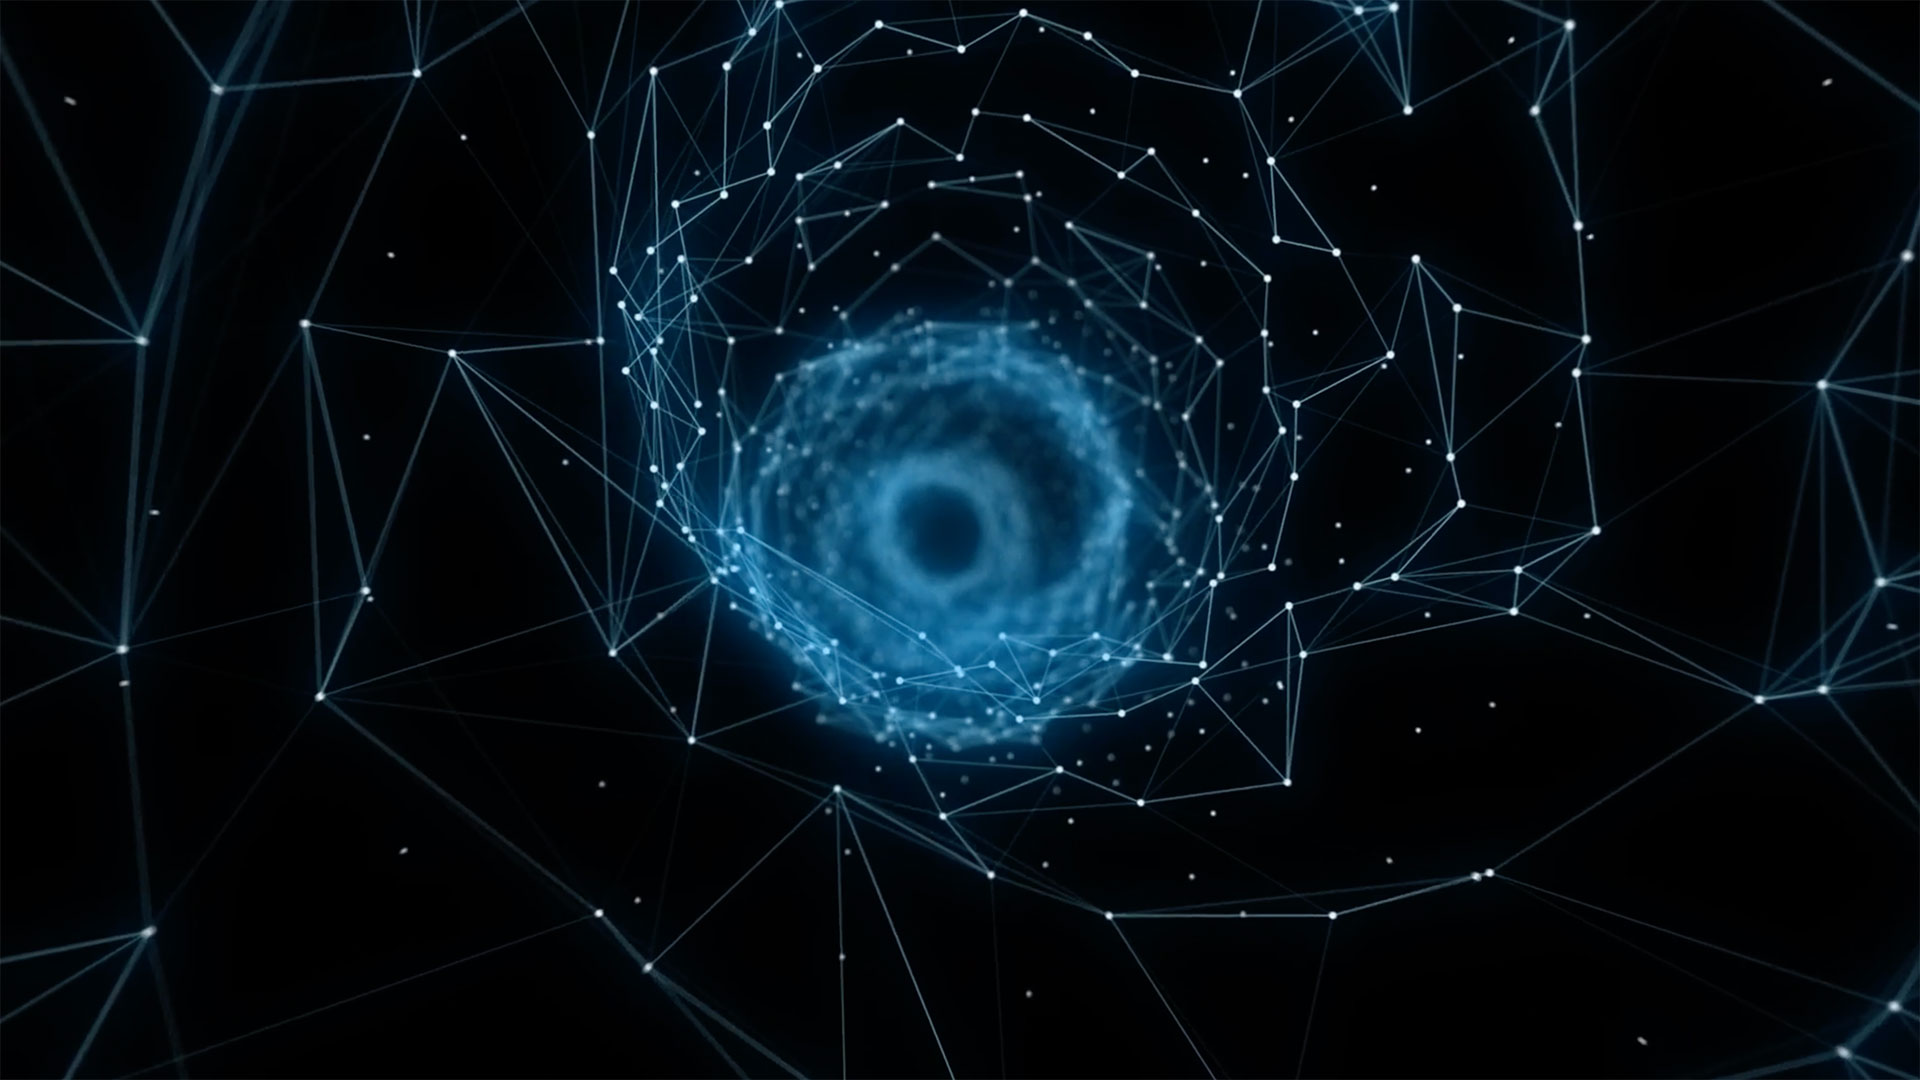
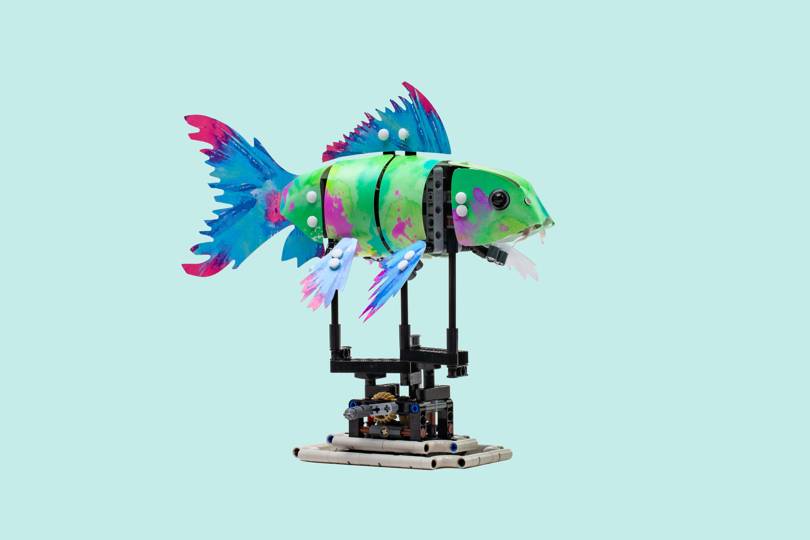
3. 3D Animation
3D animation is what people think of when they hear the words ‘computer generated’.
This type of motion graphic is what you would use to create a Hollywood movie or other high budget film.
You can create 3D models within software like Cinema 4d and After Effects. They make what you do look more realistic on screen.
You could use 3D models to show how your business models work. Pieces of your company would move around and come back together again. Between each action, the model would show what the that part fo the business does.
Capacity Studios use 3D modelling in this 3D video for Lamborghini. The range of camera angles and fast cuts create excitement. It is perfect for a computer game.
4. Video Production
Video production describes a live-action setting. It’s where people come into play instead of drawings or animated characters. There’s nothing drawn or animated in the background.
Video production is cheap compared with Motion Graphics. It doesn’t need animators or 3D artists. You can shoot everything live. That means it doesn’t need as much post-production editing either.
In this skateboarding video, director David Holm uses his skills as an animator. But instead of using cartoons, he films live action sequences. Each sequence has many different angles, fast cuts and shows the eye of a graphic artist. It could be motion graphics. But it isn’t.
The answer to the question What is motion graphics? is broad. But it is a question worth asking. Motion graphics is booming. For each new designer that joins the workforce, there are as many new projects. Digital media has opened more distribution options than ever before.
When live action is not an option motion graphics is seen as the answer.
But as these examples show, the best work involves taking risks.
But with motion graphics there are few limitations. And once you get outside your comfort zone, your motion graphics will have impact.
Whether it is whiteboard animation, 2D animation, 3D animation or video production, motion graphics are an engaging way to get your point across.
Related stories
Try this sniff test to see if your business stands out
Business intelligence tools give your business a competitive advantage
6 undeniable reasons why Power BI is a good skill to have for any marketer
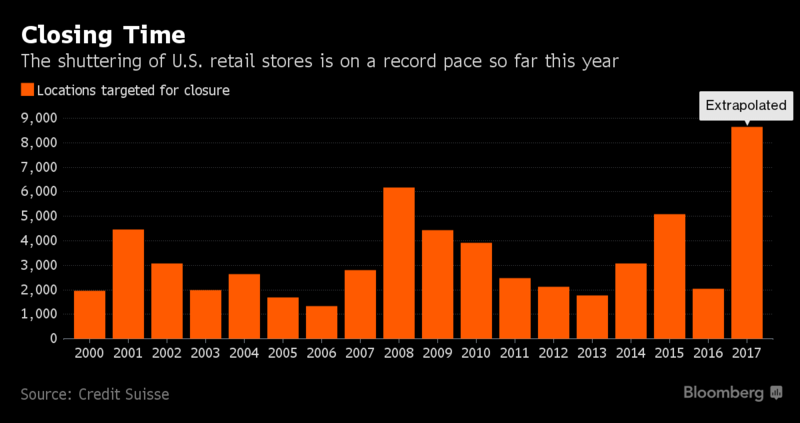
Everything you need to know about advertising on one annotated slide
About the author

My name is Andy Pemberton. I am an expert in data visualization. I guide global clients such as Lombard Odier, the European Commission and Cisco on the best way to use data visualization and then produce it for them: reports, infographics and motion graphics. If you need your data visualized contact me at andy@furthr.co.uk or call 07963 020 103
Posted in: Uncategorized | Leave a Comment