How to make a HIGHLY PERSUASIVE data visualization: a three minute guide

data_scientist

Visual perception research has established the fact that visual information is powerfully and inescapably persuasive in a way that text and speech aren’t.

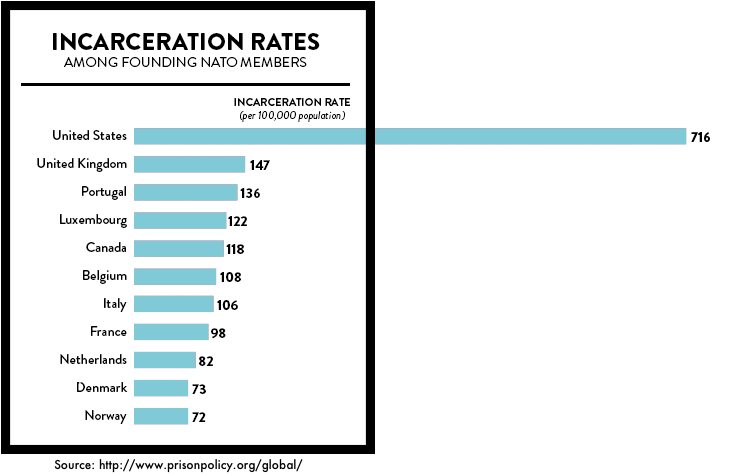
For instance, I could tell you the United States imprisons five times as many people as most nations despite having similar crime rates. I can cite sources and link to essays and research.

Zzzzzz.

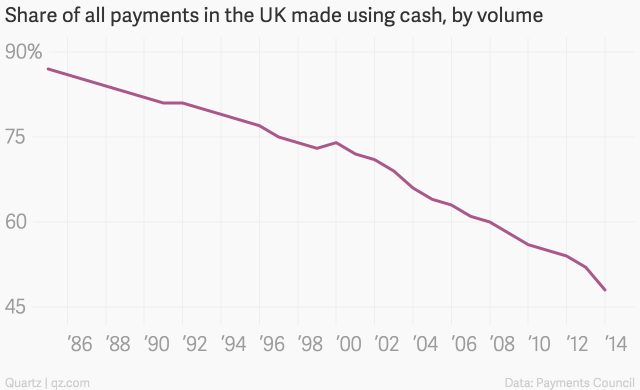
Or, I could show you this:

incarceration-rates-nato

New research is adding texture and nuance to this understanding of how data visualization persuades.

Research from Ansul Pandey at New York University indicates the persuasive power of dataviz may not be universal.  It has found the success of a visualization seems to be dependent on the person assessing it.

When participants in their study didn’t have strong opinions about the message being conveyed, visuals persuaded effectively.

But they were much less effective when participants held strong opinions in opposition to the message being conveyed.

Obviously, it takes more to convince someone who doesn’t believe you than someone who simply doesn’t know or doesn’t care.

But wait. There’s more.

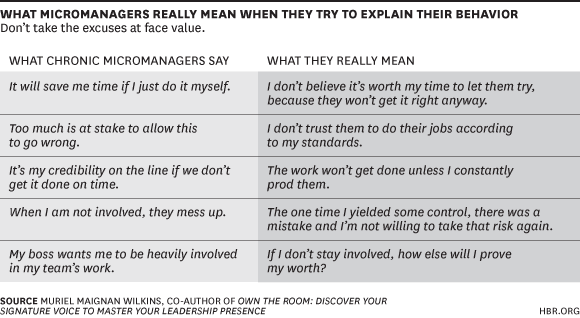
Those with stronger opposing views were more likely to be swayed when a disagreeable message was presented in the form of a table, rather than a chart.

Weird, right?

An unrelated study discovered people who were most likely to hold misperceptions tended to reject ALL factual corrections no matter what.

Chart, table, they did not care.

Anyone who has who has argued fruitlessly with a conspiracy theorist knows that facts presented to zealots are often rejected not because they are wrong but because they felt threatening to the subject’s world-view and their identity.

In other words, a chart may cause someone with a polar opposite view to dig in their heels because it’s too psychologically painful to confront compelling evidence that conflicts with their beliefs.

But researchers found another way to win over these groups that had nothing to do with charts: affirmation.

Asking them to recall a time when they felt good about themselves made them more willing to acknowledge uncomfortable facts.

Tuft University’s The Visual Analytics Lab have also discovered the effectiveness of visualization changes with mood, gender, and personality type.

What’s more, priming a subject can affect how they perform when reading a graphic and what they take away from it.

For instance, a bored, agitated, tired, audience won’t make sense of your charts and the message you want to convey as well as one that’s engaged, happy, well-fed, and generally positively primed.

And the ability for people to get information from a chart affects their judgment of the data itself. The most anti-persuasive thing you can do is to make a bad chart that frustrates people.

Number one on the list is data viz turn offs? Complexity.

If there’s too much information and no clear, salient point that we can intuit, we tend to shut down, unless we have the time, space, and inclination to work hard at finding the narrative in the visual.

Certainly in a presentation setting, that’s unlikely.

Number two on the list of turn offs is too many salient points fighting for attention. I always keep in mind the design aphorism, “if everything is bold, nothing is.”

Number three: charts that flout convention. If you depict time going right-to-left, say, or put scale categories out of order, you risk messing with your reader’s expectations, and the likelihood is they will give up.

So how do you get it right?

Here’s a deceptively simple, golden rule for visualizations I always use: “no title, no infographic.”

That’s just another way of saying, “Know what you want to say and use the data visualization to say it.”

So imagine the pay off, the conclusion, the final slide in your presentation  – and put that first.

And make it specific.

So don’t call it “The Future of Retail.”  Instead, do call it “The Future Of Retail is Online Commerce.”

Good luck.

Posted in: Infographic of the day | Leave a Comment

Is part-time work the reason the Dutch are one of the world’s happiest nations?

20150516_woc234

The Netherlands consistently ranks as one of the best places in the world to live, says The Economist. Dutch kids are among the happiest in the world, according to Unicef.

Some attribute their high quality of life and general good nature to a rather laid-back approach to work: more than half of the Dutch working population works part time, a far greater share than in any other rich-world country.

On average only a fifth of the working-age population in EU member states holds a part-time job (8.7% of men and 32.2% of women); in the Netherlands 26.8% of men and 76.6% of women work less than 36 hours a week (see chart).

Posted in: Chart of the day | Leave a Comment

BLAM! Coworking spaces pack a real punch, say researchers

521c5c98554b27560c516f28b03b37a3

As I write this I am sitting in a co-working space.  I don’t own it or have shares in it or anything, I am just a regular coworker. I come here most working days I’m not on the road. It’s nice.

I am not alone in thinking so. Studies suggest there is something about coworking spaces.

Researchers have discovered people who belong to them report levels of thriving approaching six on a seven point scale. That’s a point higher than the average employee in an average office.

What makes co working spaces – membership-based work spaces where diverse groups of freelances or remote workers toil together in a shared, communal setting – so effective?

coworking-manifesto-logo-3bef570d0d1f15d4e98370f9ed864e35

1. People who use co working spaces see their work as meaningful.

Sure, freelancers are working for themselves, but researchers found it was about more than that. People working in coworking spaces reported being able to bring their whole selves to work.

Unlike a normal office, co-working spaces consist of members who work for a range of different companies. Free from competition or internal politics, they don’t feel they have to put on a work persona to fit in.

Working among different kinds of workers can make your work identity stronger.

Secondly, meaning can come from working in a culture  – or “value eco-system” as its been called – where helping each other out is the norm and they are many opportunities to do so.

Lastly, the social mission inherent in the Coworking Manifesto, an online document signed by over 1700 working spaces, articulates the values the coworking movement aspires to, namely, community, collaboration, learning and sustainability. Coworkers can feel themselves part of a social movement if they want to.

2. Coworkers have more job control

The coworking space I work in, like most of them, is accessible 24/7. When there is  deadline members can work long hours. When its quiet they can go for a lunchtime swim at a pool nearby. They choose whether to work in quiet spaces or more collaborative spaces where interaction is encouraged. Or they can work from home, without getting into trouble with their boss.

Autonomy is nice, but researchers  discovered that coworkers  also value structure in their working lives.

Paradoxically, a limited form of structure provides an optimal degree of control in the lives of independent workers.

Newsweek-cover-crop

3. Coworkers feel part of a community

Co-workers can choose how they socialise with others. There is usually a coffee space where, crucially, you can choose to hang out and chat. While some will socialise more than others, researchers found even quiet coworkers still felt a strong bond to the community. Perhaps because there was the potential for interactions if they needed them.

So what does all this  mean for traditional offices?

I’ve invited clients into my coworking space for workshops with great success.

But more profoundly, there are lessons for employers about allowing people to craft their work in ways that give them purpose and meaning.

For example, some companies are adopting a best planning practice of providing a 1:1 ratio of desk seats to seats in shared settings for quiet or collaborative work respectively.

But what it’s really all about is autonomy and the chance to be yourself at work.

The lesson is that if you give people the space and support to be their authentic best selves they will thrive, and bring their best energy and ideas to the office each day.

Even if it is a corporate headquarters.


Posted in: Infographic of the day | Leave a Comment

Apple is going to war with Spotify over your music

Godzilla-Vs-Megalon-1973

A few years ago, there was a theory abroad that Apple Inc only started to become the global juggernaut it is today when it got involved with music – something that people truly love.

Certainly, it was the introduction of the iPod that moved the Apple beyond status as a cult computer for graphic designers.

Then, after settling a claim with The Beatles’ Apple recordings, Apple went hell for leather for the music market. Cool music meets cool tech., at the time it seemed a match made in branding heaven.

But now the marriage appears to be going sour.

Last week, it was reported that Apple had been pressurizing music labels to kill off the free streaming service on Spotify.

Apple were also allegedly proposing to pay YouTube’s music licensing fee to the Universal Music Group if they removed their songs from Google-owned Youtube too.

Right now, the US Department of Justice, Federal Trade Commission and even the EU’s Competition Commission are looking into the accusations.

So what has Apple got against streaming free music?

Apple wants to clear the way for the relaunch of Beats Music this summer. (As you will recall, they acquired the headphone manufacturer last May for $3billion.)

If Apple can eliminate ad-supported free services such as Spotify, it can reduce competition to its own service Beats Music.

Yes, that is a bit sad.

Once Apple’s iTunes download store was a dominant power in digital music. But sales of iTunes declined 13% last year, thanks to streaming services such as Spotify.

Timing is an issue here. Spotify’s catalogue licences are about to expire this summer. If Apple can apply pressure on the music industry perhaps they won’t renew their contracts….

But Spotify is still growing.

Available in 58 countries it has 15million paid subscribers (that’s about 25% of its total users). In 201, it became profitable in the UK (and only the UK so far).

Truth is, even if Apple succeed in driving a wedge between Spotify and the labels, there are more services lining up to give out music for free (with advertising) including Youtube, SoundCloud, Pandora and a host of pirate sites.

Meanwhile, people are spending more than ever on ticket sales. North American concert ticket sales revenues hit $6.2billion in 2014.

But the battle for music sales is sinking into an unedifying slugfest over a market whose cash value appears to be diminishing.

If Apple wants to regain dominance in the music business it will have to come up with better ideas than this.

Never thought you’d read that sentence eh?


Posted in: Big Picture story | Leave a Comment

Are you a micromanager? Six warning signs

dwp-insert

If you are anything like me, you HATE to be micromanaged. It’s demotivating, isn’t it?

But are YOU a micromanager? And if you are, do you even know it?

Here, according to The Harvard Business Review, are six warning signs.

  •  You’re never quite satisfied with deliverables.
  •  You often feel frustrated because you would’ve gone about the task differently.
  •  You laser in on the details and take great pride and /or pain in making corrections.
  •  You constantly want to know where all your team members are and what they’re working on.
  •  You ask for frequent updates on where things stand.
  •  You prefer to be cc’d on emails.

Yes, the devil is in the detail, but if you are applying the same level of intensity to every task, you need to stop. Because it’s harming your team’s morale and ultimately their productivity. More than that you are stunting their development and creating an organizational vulnerability when you are away.

Here’s four way’s to STOP micromanaging.

1. Get over yourself

You can rationalize your behaviour until you are blue in the face. Here’s some excuses that mirco-managers use and what they really mean. Sound familiar?

whatmicromanagers11

2. Let it go

Let go of the minutia. This can be hard but try a little at a time. Instead focus on just the big ticket items where you can add value

3. Give the what, not the how

There is a world of difference between having an expectation about a deliverable and dictating how to get that result. So articulate what the final outcome should look like, but don’t give blow by blow instructions of how to get there. When in doubt, share the what and then ask (rather than tell) your team member how they would plan to get there. Different approaches to yours can often yield excellent results.

4. Expect to win

Underpinning your need to micromanage is your fear of failure. By magnifying the risk of failure your employees enageg in learned helplessness where they can only function if you micro manage them. A vicious cycle ensues.

Instead set your team up for success. Explain what success looks like. Provide the resources needed to meet those conditions. Over time, you’ll see a loss every now and then helps build a strong track record in the long run.


Posted in: Infographic of the day | Leave a Comment

Furthr’s new business guidelines – explained!

glengarry-glen-ross_1

1. PICK A TARGET

This can be a tip off from your network, or a job ad, or a repeated visit to the Furthr website, a direct enquiry or someone checking your profile of LinkedIn.

These can all be buying signals.

Try to stay inside the target: finance.

2. CREATE IMPACT

To achieve cut through you need impact so your target notices you. At Furthr we write a letter or organize an event.

The crucial point is that impact must occur offline.

The you follow up online…

3. GET A SIGNAL OF INTEREST

It’s easy to guess people’s email addresses. So once you’ve sent them a letter, a week later send them a LinkedIn contact request.  Mention the letter you wrote them.

If they respond, that’s interest. So now you can…

4. CALL THEM

It’s the only way to get people warm. But don’t sell. Use this script instead:


ACT ONE: Exposition

Hi!  how are you?

My name’s Andy Pemberton. I own a company called  Furthr.  We help large companies with their comms.

I sent you a letter last week –  have you seen it yet?

ACT TWO: Rising action

We work with  RNLI,  the  United Nations’ World Food Programme,  CISCO and AVIVA.

ACT THREE: CLIMAX

 Can I show you some of our work…?

ACT FOUR: FALLING ACTION

So when’s a good time for a coffee? 

ACT FIVE: RESOLUTION

Maybe I can email it to you?


If you can’t get through try an in mail.


5. MEET THEM OUTSIDE THEIR OFFICE

Otherwize its all business and the meeting will be cold.

They say 11 points of contact are necessary for a sale. Once you’ve done all this, they will be a bona fide prospect and you can revisit them again and again until they have a problem Furthr can help them with.

Lookout for our event guidelines – coming soon!


OTHER TIPS
Go to the top, that’s who refers you. Middle managers will NEVER refer you.


Posted in: Tip of the day | Leave a Comment

To boost business growth, flip your pyramid

g829

Here at Furthr, we love an organisational pyramid.

In fact we invented our own, called The Content Tree. 

We use it to start thinking about targeting content and developing a tone of voice.

But here is another couple of pyramids we think are very useful.

W150429_WANG_HIERARCHYOFBUSINESS

These represent the hierarchy of business needs. The most important is brand and that sits at the top.

The blue represents the time a business spends on this stuff. As you will see, many organisations spend the least time of the most important stuff. Why?

According to the Harvard Business Review, “The punishing forces of quarter-to-quarter performance expectations have forced business leaders to scramble for short-term profit gains at the long-term expense of the organisation.”

Most of us can recognise this idea.

Companies spend way too much time on the less important matters of regulatory compliance and operational efficiency – stuff that could perhaps be completed by automated means, while the really important stuff towards the top is overlooked in the rush to meet targets.

But really, businesses should be spending their time like this:

W150429_WANG_HIERARCHYGROWTH


Revenue growth, business model transformation and brand are the business priorities that help  organizations grow and compete.

Posted in: Tip of the day | Leave a Comment