5 tips on how to make a Tableau dashboard look good
A Tableau dashboard is a powerful marketing and sales tool. It can help you to visualize data in an interesting and engaging way.
Despite this, there are many pitfalls that marketers fall into when building dashboards.
In this post, I will share five tips on how to make your Tableau dashboard look good.
What is a Tableau dashboard?
A dashboard is a combination of several views of data. You can arrange them for a presentation or to keep an eye on data as it changes.
A Tableau Story is different. It is a sequence of views or dashboards that work together to convey information.
Building dashboards with Tableau allows beginners to create engaging, interactive visualizations in minutes.
In a few clicks, you can combine data sources and dd filters. You can drill down into specific information.
Tips for Tableau beginners
If you are new to Tableau consider these tips:
You do not need to wait for your source data to be perfect. Tableau can help you identify so-called “dirty data. “
When connecting to data, there is a method that allows you to use a connection from another workbook. On the Connect panel, choose the “other files” option. Then select the workbook with the data source you’d like to use in the new workbook.
You can copy whole dashboards between workbooks too. Right-click on the tab of the worksheet and /or dashboard you want to copy. Next, select “copy sheet” from the menu. Then right-click over the tab area of your destination workbook. Then you can select “paste sheet.”
Remember, data visualizations are generally produced for others to read. So it is a good idea to ask yourself, “Would this view make sense to anyone else?”
That’s where visual best practices come in. It can help you make dashboards that actually make sense to other people.
Don’t forget to test for performance!
What is Tableau dashboard size best practices?
The golden rule is to author at your final display size.
Tableau dashboards are set to use a fixed size. If you keep this setting, be sure to build your visualization at the size your audience will view it at.
You can set Size to Automatic. This makes Tableau adapt the dimensions of a visualization based on screen size.
If you design a dashboard at 1300 x 700 pixels, Tableau will resize it for smaller displays. Sometimes this results in scrunched views or scrollbars. The Range sizing feature is helpful for avoiding this.
When it comes to Tableau dashboards, there are many things that you can do to make them look good.
In this post, I will share 5 more tips on how to make your Tableau dashboard look great.
1. Organize your data
One of the best ways to make your Tableau dashboard look good is to organize your data.
You have spent time and effort collecting, organizing, and cleaning your data,. Now it makes sense to spend more time making sure you display this information how you want it to be.
Using the Tableau easy filter option is a great way of making your data look good. It will keep things organized at the same time.
2. Use dashboard actions for quick insights
The best way to make your Tableau dashboard look great is by adding interactive elements. One example is dashboard actions.
Dashboard actions mean users can get instant insights into their data. All they have to do is click on the visualizations.
Imagine you have a visualization of how sales vary by region and how sales relate to the size of the company. Adding a dashboard action that shows how many clients there are per region would add context. It would allow your users to see how this data impacts your business.
3. Take advantage of filters
Another way to make your Tableau dashboard look great is by taking full advantage of filters.
Filters help achieve valuable insights. They show how different parts of your data vary from each other. You can use colour coding conditional formatting with thresholds. These .make sure users see patterns in your data.
But remember: too much colour can be a bad thing. This is because colour is powerful. Each different colour has an emotional meaning. Red can raise the alarm, blue is calm. Drenching your charts in colour is a typical beginner’s mistake.
For a premium touch, instead, use different shades of the same colour. Google uses this method for its data analytics. By using different shades of blue, their charts cool calm, and in control.
4. Make sense from all angles
Sometimes it’s tempting to cram as much information as possible into your dashboard. But it is important to make sure that all the data is easy to understand from all angles.
Once again, try not to use too many fonts and colours and make sure that you align everything.
A sans font such as Ariel is easier to read small.
5. Use storytelling to engage users
The best way how to make your Tableau dashboard look great is by using storytelling.
Storytelling helps you to communicate complex information in a clear and concise way. It helps keep users engaged with your data.
To tell a story with your data, pay special attention to the title of your chart. The title should be the conclusion of the data beneath it.
Eye-tracking surveys reveal readers look at the headline first. Then they look at the chart to see if the visualization supports the conclusion in the headline.
If you put the conclusion of the data in the chart headline you will be able to develop a story over a series of charts. And your readers will be able to follow it.
If you do not put the conclusion in the headline, your readers will not be able to follow and they will get lost.
It is shocking how fast readers abandon charts they do not understand.
Use these techniques. You will make your Tableau dashboards more engaging and visual.
The golden rule is that it is important that your data is correct. But it is also important that your data visualizations are interesting. Make sure you do not overwhelm your charts with colour. Ensure that you have a story to tell. Tell that story by putting the conclusion of the data in the headline. Then make sure the chart supports that headline. If you do these things, your Tableau dashboards will look good.
Related Stories
Try this sniff test to see if your business stands out
Business intelligence tools give your business a competitive advantage
6 undeniable reasons why Power BI is a good skill to have for any marketer
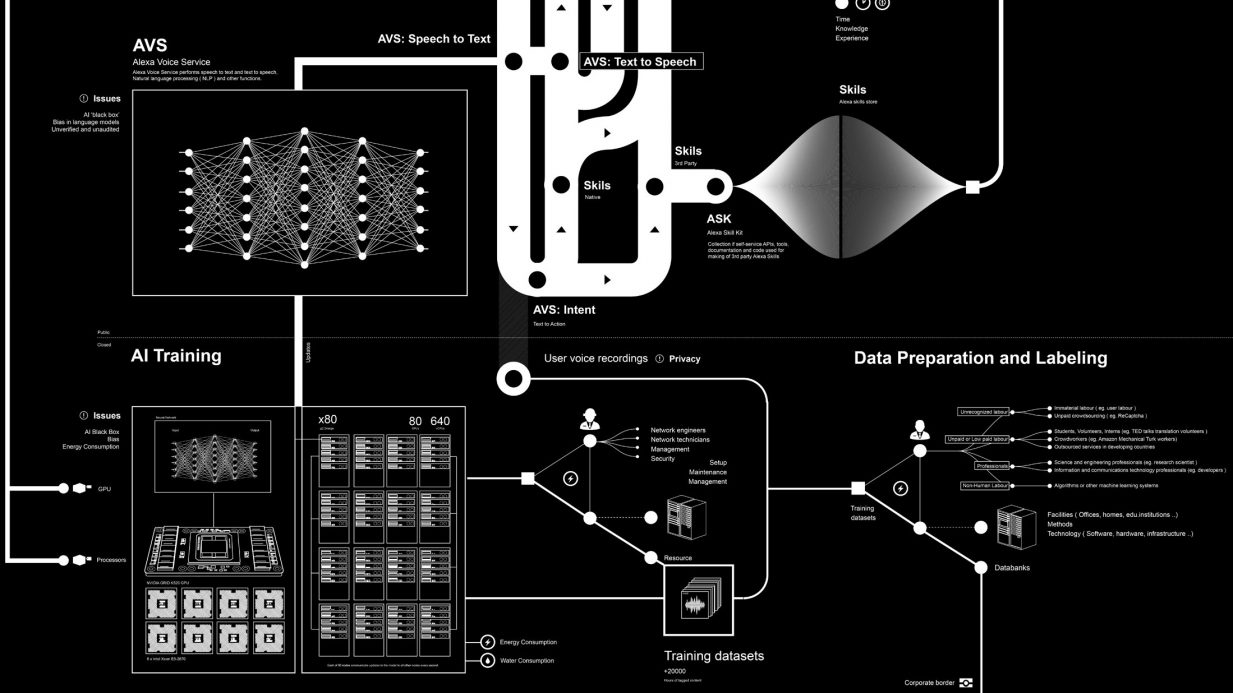
Everything you need to know about advertising on one annotated slide
About the author

My name is Andy Pemberton. I am an expert in data visualization. I guide global clients such as Lombard Odier, the European Commission and Cisco on the best way to use data visualization and then produce it for them: reports, infographics and motion graphics. If you need your data visualized contact me at andy@furthr.co.uk or call 07963 020 103
Posted in: Infographic of the day | Leave a Comment