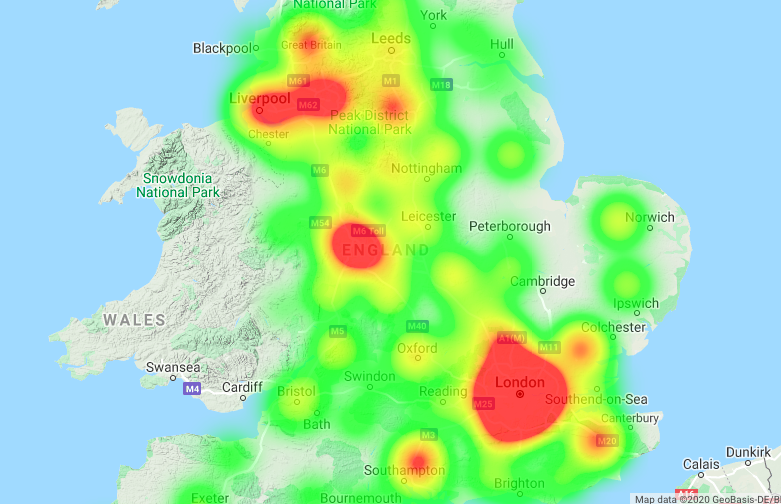
UK exit strategy: Furthr’s COVID-19 heatmap showing how the disease is spreading is in BETA
April 14, 2020
 Data from John Hopkins suggest the UK may have hit a peak of new cases of COVID-19 last week, on Thursday April 10.
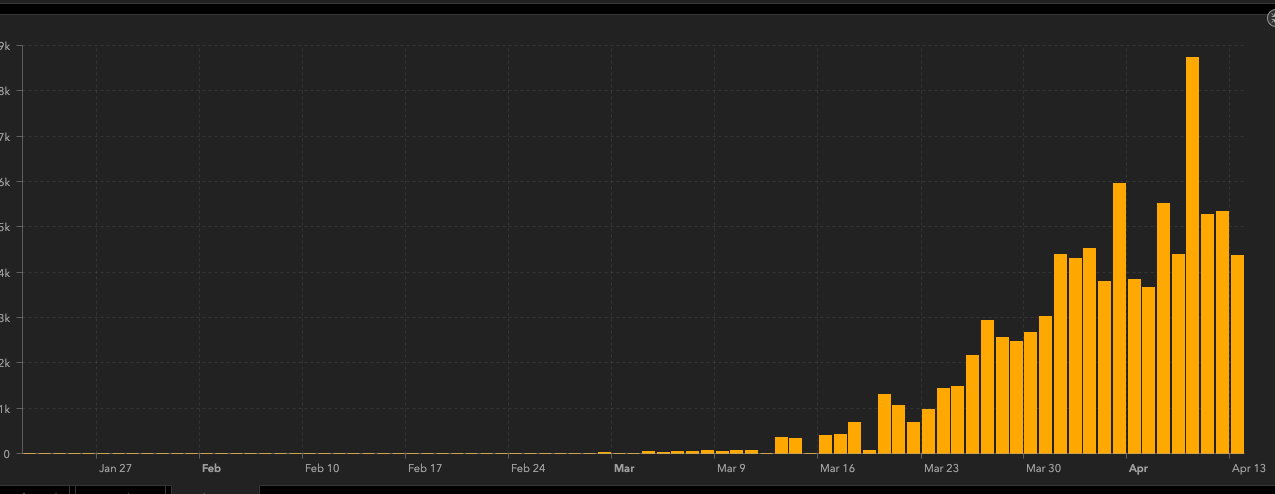
If that is true – and it takes 12 consecutive days of a downward trend to prove we are past the worst point – then thoughts will turn to act three in this tragedy: how the UK gradually starts to lift restrictions.
With that in mind, Furthr are working on a heat map of the UK showing where most of the COVID-19 cases are. (See above) We are also adding a timeline to show how the disease is progressing.
Posted in: Infographic of the day