These charts show what to expect in the next ten days
April 7, 2020
 Posted in: Infographic of the day

When will lockdown be over? It’s a question we’d all like the answer to, and of course, we do not know.
However, it is possible to make an estimation.
Researchers at the FT suggest we in the UK are on a similar trajectory to Italy, who went into lockdown weeks before the UK. Let”s compare the two on a timeline to see what we in the UK have in store.
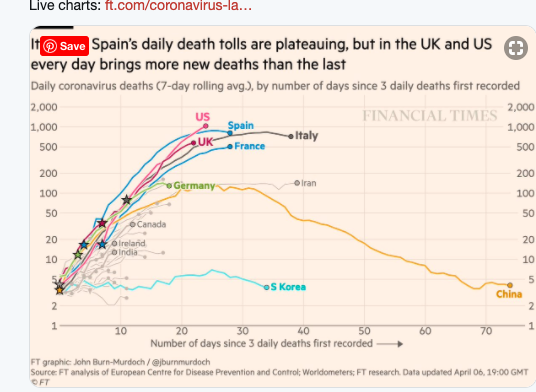
Italy’s lockdown started March 9, 2020. After that new cases – a key metric when measuring the progress of the disease – peaked on March 27, 18 days after the lockdown began. (Daily deaths in Italy and Spain peaked around 23-24 days after lockdown started. See chart below.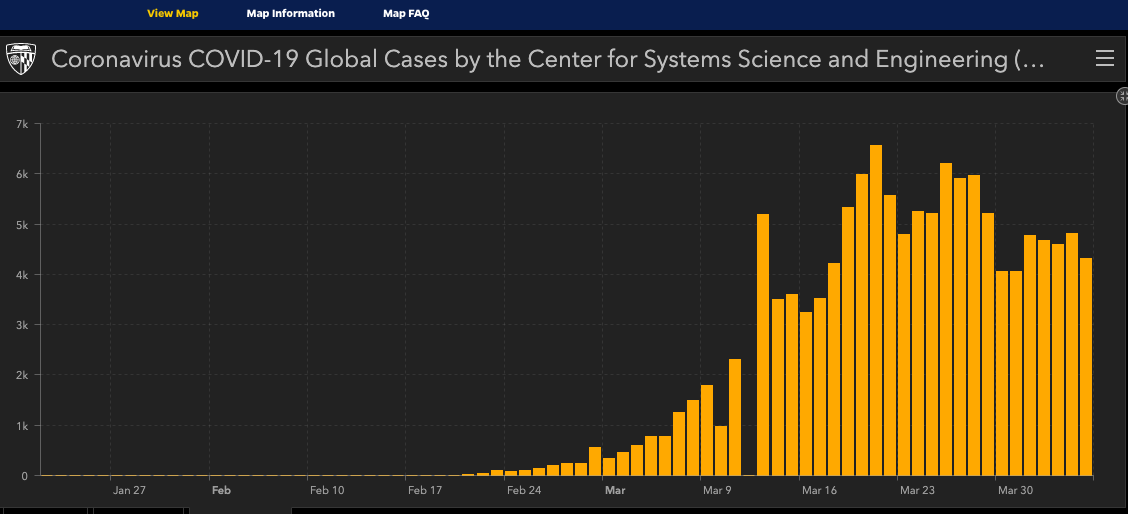
Here in the UK our lockdown started March 24, 2020. As of today, we have been in lockdown for 14 days. If we were to map to Italy’s experience, we could expect to hit peak new cases in five days, Saturday April 11. (UK deaths could peak with deaths in 7-10 days, the middle of next week.)
As the UK runs into a hot zone of illness and death from Corvid-19, Boris Johnson’s sickness could not have come at a worst time. We wish him a speedy recovery. (Insiders say that if Boris goes onto a ventilator, UK will require new Prime Minister.)
When will it be over?
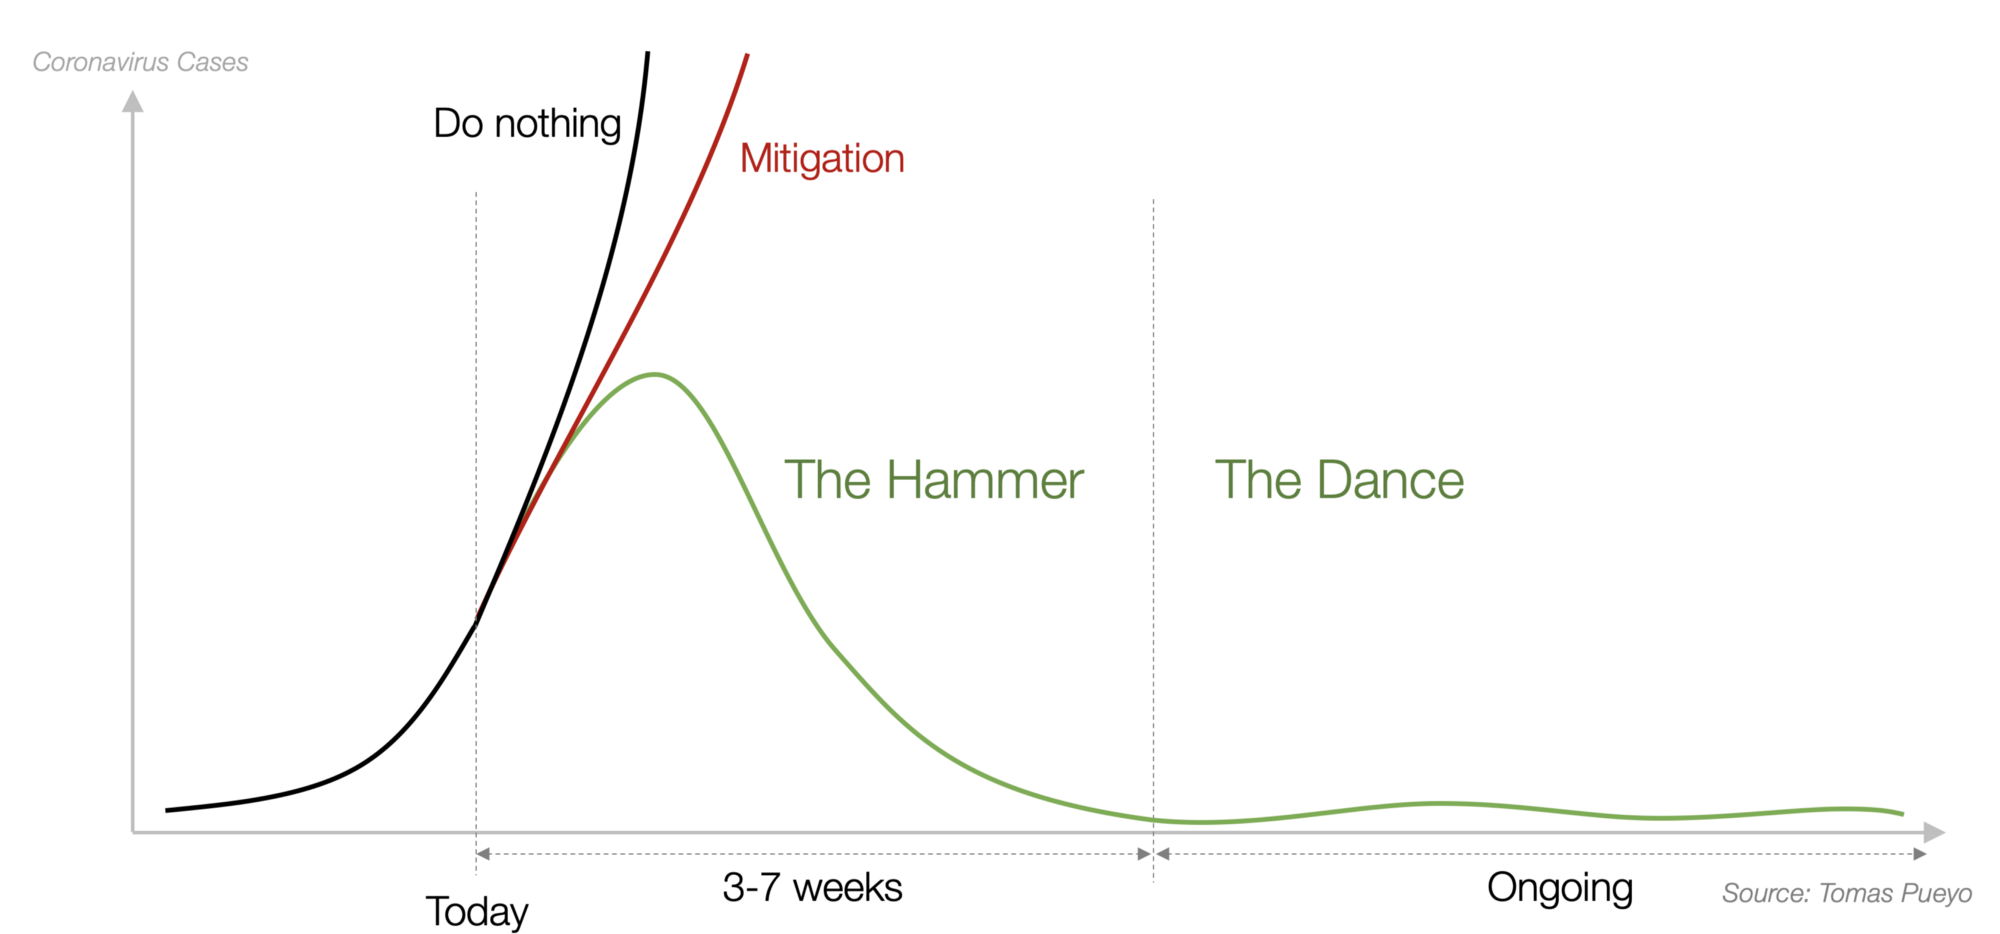
Finally we could hazard a guess, based on Italy’s data, at what point we could start to return to a level of new cases that were “manageable” ie the health system could cope with them. At that point some restrictions could be relaxed as we enter the phase of containment known as “the dance.” see below.
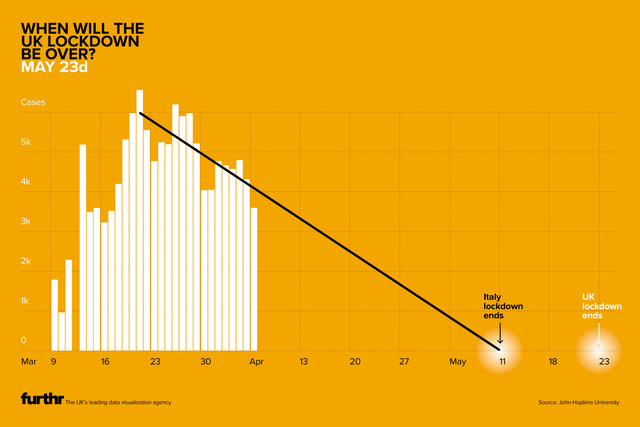
Based on an extrapolation of Italian data we see that lockdown conditions could end May 11, if the rate of decline in new cases stays as it is now. If UK continues to track to Italy’s trends we can expect restrictions to be eased May 23rd. Here’s what that looks like.