The American dream is changing forever and this must-see chart explains how

chart-02-1
This chart is taken from “Capital in the Twenty-first Century,” a new book about rising inequality by Thomas Piketty, a French economist, is being hailed as the most important economics book of the year.

It’s central conceit is that the equality many developed nations experienced in the 20th century was a blip. Inherited wealth, it says, is back and it’s coming to dominate society.

The top percentile hasn’t taken such a large share of over-all income since 1928. The difference between the bottom line (wage income) and the top line (total income) is accounted for by income from capital—dividends, interest payments, and capital gains. Because they own a lot of wealth, the one-per-centers receive a lot of their income in this form.

BN-CL704_bkrvpi_GV_20140421133240

Posted in: Infographic of the day | Leave a Comment

Infographics play a central role in the most important economics book of the year

chart-01

“Capital in the Twenty-first Century,” a new book about rising inequality by Thomas Piketty, a French economist, is being hailed as the most important economics book of the year.

It’s central conceit is that the equality many developed nations experienced in the 20th century was a blip. Inherited wealth, it says, is back and it’s coming to dominate society. The book proves its point with easy to understand infographics. And that is completely new. The New Yorker explains:

“Partly by using new sources of data, such as individual tax records, and partly by expanding the research to other countries, Piketty and his colleagues have deployed their charts to reshape the entire inequality debate… Now, thanks to Piketty et al., the remarkable gains of those at the very top can’t be avoided. And this means that the issues of politics and redistribution can’t be avoided either.”


Posted in: Big Picture story | Leave a Comment

This chart shows how the Chinese are changing the face of global tourism forever

20140419_IRC733

Nearly one in ten international tourists worldwide is now Chinese, with 97.3m outward-bound journeys from the country last year, of which around half were for leisure. Chinese tourists spend most in total ($129 billion in 2013, followed by Americans at $86 billion) and per tax-free transaction ($1,130 compared with $494 by Russians). More than 80% say that shopping is vital to their plans, compared with 56% of Middle Eastern tourists and 48% of Russians. They are expected to buy more luxury goods next year while abroad than tourists from all other countries combined, says The Economist.  By 2020 the number of foreign trips made from China will double, predicts Aaron Fischer of CLSA, an investment firm, and spending by Chinese tourists abroad will triple. The key point: nearly half of China’s population is now online, and two-thirds of those planning to travel use online material when preparing their itinerary.


Posted in: Infographic of the day | Leave a Comment

This chart shows Americans hate adultery much more than other developed nations

20140419_gdc146

ON APRIL 17th the New Hampshire Senate is due to decide whether to legalise adultery. A 1791 law calls for whipping, jail time and ruinous fines for breaking the sixth commandment, says The Economist. Americans are far more likely to disapprove of adultery than people in other rich nations, especially the French. They have grown more likely to frown at cheaters over the years—in contrast to their attitudes to gay sex, which have softened enormously.

Posted in: Infographic of the day | Leave a Comment

This brilliant chart shows you can buy three houses in Northern Ireland for the price of one in London

how-many-houses-can-you-buy-for-the-cost-of-one-in-london-feb-2014-data_chartbuilder-4

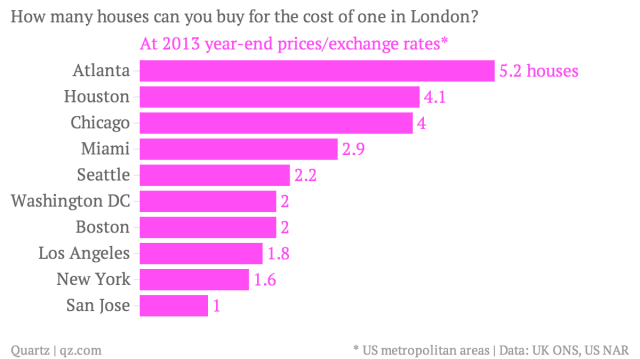
The average London home in February was worth £458,000 ($766,000), up nearly 18% from a year ago. This was the fastest annual pace since at least 2002. But what does that really mean?  In an effort to put London’s turbo-charged property prices in context, onion news site Quartz have come up with the brilliant chart above, which shows how many houses you could buy outside of the capital for the same cost as a single dwelling in London. In Northern Ireland, for example, you could buy three homes and still have nearly £70,000 left over to deck them out with chandeliers and water features. The chart below, shows how many houses you could buy in Atlnata Georgia, for the cost of a London home. (Five.) 

how-many-houses-can-you-buy-for-the-cost-of-one-in-london-at-2013-year-end-prices-exchange-rates-_chartbuilder-1

Posted in: Big Picture story | Leave a Comment

Use social shares as a success metric and every article you publish will be about Grumpy Cat

138553187__460069b


Here is the dirty truth about shares on social media.  “We’ve found effectively no correlation between social shares and people actually reading,” says Tony Haile, an adjunct professor of journalism at Columbia. Put simply, people share links they don’t bother to read. But if you base the success of your website on pure traffic instead, you’ll end up with endless posts about Grumpy Cat. “If you are a slave to the numbers, then you start creating more stuff like that… and pretty soon you will have a site full of trash and salacious garbage,” says BuzzFeed CEO Jonah Peretti. So what is the answer? MIT’s Technology Review  deny their journalists access to statistics about readers and attention, because they’re concerned that it might distort their judgement about which stories to cover or how much time to devote to them. But then they have no idea what how their audience behave. The answer is a gentle blend of what’s good for numbers and what’s good for the brand. In other words, hire a great editor.

Posted in: Infographic of the day | Leave a Comment

These charts suggest NATO is unprepared for a militarised Russia

90e1aa53-6642-46cb-96d4-fec981c0ec8a.img

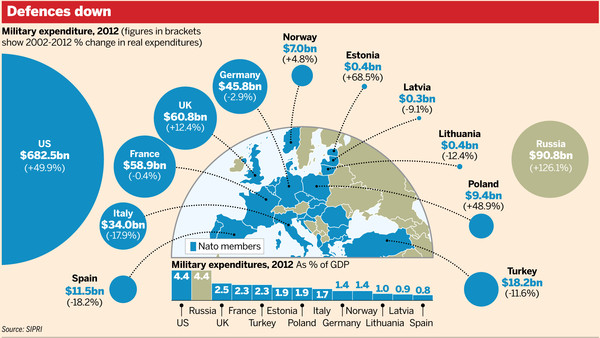
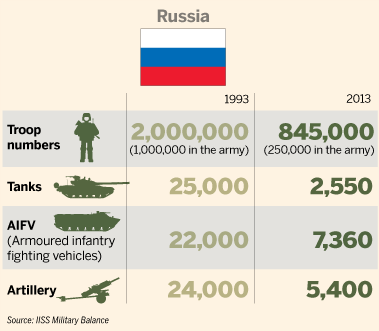
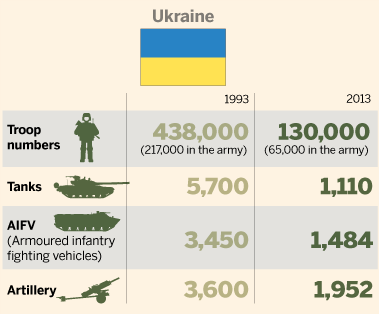
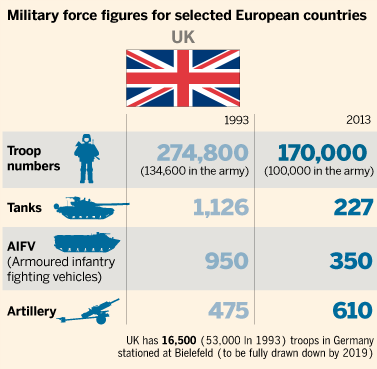
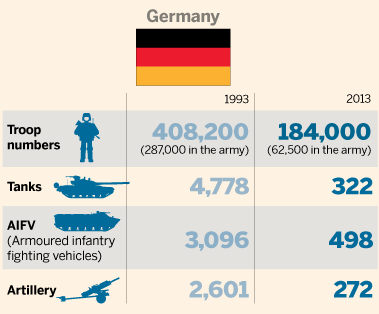
Long-term cuts to spending have been exacerbated by the financial crisis. Defence spending, in real terms, has fallen 21.5 per cent in Italy, 9.1 per cent in the UK, 4.3 per cent in Germany and is flat for France since 2008, according to the International Institute for Strategic Studies. Over the same period, Russia’s military spending has risen 31.2 per cent.

9de5da6a-bf3d-11e3-b924-00144feabdc0.img

9f45da54-bf3d-11e3-b924-00144feabdc0.img  9a4063da-bf3d-11e3-b924-00144feabdc0.img 991d9e78-bf3d-11e3-b924-00144feabdc0.img 9b6f04c8-bf3d-11e3-b924-00144feabdc0.img

Posted in: Big Picture story | Leave a Comment

Google and Facebook are turning to content to boost ad profits

b129ff7c-bffe-11e3-9513-00144feabdc0.img


Google and Facebook are expanding their small in house creative agencies (The Zoo and The Creative Shop, respectively)  and this chart explains why. They want to to capture some of the $400bn of global ad spending that currently goes towards traditional media such as television. Specifically they want to get into the biggest part of the global ad market: brand advertising, which is about increasing brand awareness and purchase intent, rather than getting an immediate response. The way to do that? Content.  A Google exec told the FT: “People don’t want to just sit back and watch an ad; they want something useful from a brand. It’s only just begun,” he says. “It’s like anything at Google; it’s been in beta.”


Posted in: Big Picture story | Leave a Comment