These charts suggest NATO is unprepared for a militarised Russia

90e1aa53-6642-46cb-96d4-fec981c0ec8a.img

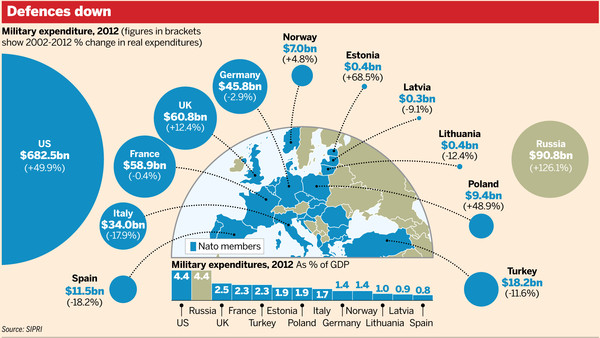
Long-term cuts to spending have been exacerbated by the financial crisis. Defence spending, in real terms, has fallen 21.5 per cent in Italy, 9.1 per cent in the UK, 4.3 per cent in Germany and is flat for France since 2008, according to the International Institute for Strategic Studies. Over the same period, Russia’s military spending has risen 31.2 per cent.

See more

Posted in: Big Picture story | Leave a Comment

Google and Facebook are turning to content to boost ad profits

b129ff7c-bffe-11e3-9513-00144feabdc0.img


Google and Facebook are expanding their small in house creative agencies (The Zoo and The Creative Shop, respectively)  and this chart explains why. They want to to capture some of the $400bn of global ad spending that currently goes towards traditional media such as television. Specifically they want to get into the biggest part of the global ad market: brand advertising, which is about increasing brand awareness and purchase intent, rather than getting an immediate response. The way to do that? Content.  A Google exec told the FT: “People don’t want to just sit back and watch an ad; they want something useful from a brand. It’s only just begun,” he says. “It’s like anything at Google; it’s been in beta.”


Posted in: Big Picture story | Leave a Comment

George W Bush’s recent portraits of world leaders could be based on Google images

putin


It seems that George W Bush’s recent portraits of world leaders may have been based on Google images.

The Guardian suggests the uncanny similarity between the portraits and photos on Google Images raises the possibility that an apron-wearing Bush did little more than trace the outlines of the venerable leaders’ visages before daubing them with paint. You decide.

merkel-2
.


Posted in: Big Picture story | Leave a Comment

This brilliant new chart on social progress shows America is slipping behind other developed nations

20140412_gdc686


A new metric, the Social Progress Index (SPI)  tracks 132 countries across 54 indicators for social progress. Importantly, the indicators do not look at inputs (like spending on education) but only outputs (like literacy). They study social, health and environmental factors, not economic ones. But when compared with GDP per capita, like here, their findings are instructive, says The Economist. Countries situated above the curve do better in terms of social inclusiveness than their economic strength might dictate, while countries below the curve perform worse.  Americans, take note.

Posted in: Big Picture story | Leave a Comment

This chart proves Obamacare is working

gallup-obamacare

The rate of Americans without health insurance has dropped to its lowest level in years, according to a recent Gallup survey. In the first quarter of 2014, the uninsured rate was 15.6%, continuing a downward trend from its height at 18% in 2013. Gallup notes that a steady decrease in the uninsured rate since 2013 is a sign that the Affordable Care Act, or “Obamacare,” is working.

Posted in: Big Picture story | Leave a Comment

This exquisite infographic tracks two decades of global migration

world-3

Austrian researchers Guy Abel and Nikola Sander have extrapolated United Nations data and discovered that the percentage of the world’s population that’s moved hasn’t changed much since 1995. They also found there are hot spots where massive migrations are taking place, chiefly from Latin to North America, between South and West Asia, and all around inside Africa.Here’s the large, potent flow of migrants to North America:northamerica

The Middle East also proves a powerful draw for many developing countries:

middleeast
And here’s Europe, which attracts migrants from a diverse set of places but sends them mainly to other parts of the continent:

europe-11

Click on each country’s name in this brilliant dynamic infographic to get a full breakdown of people in and people out.

Posted in: Big Picture story | Leave a Comment